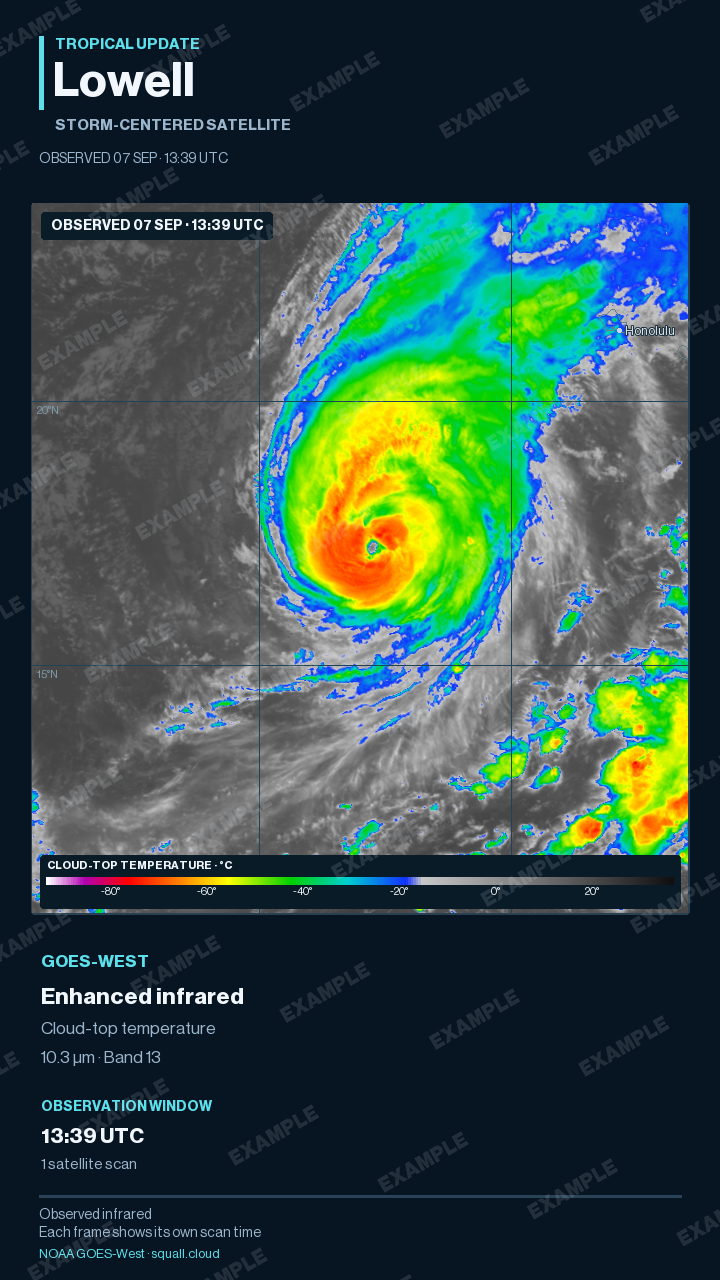
Storm-centered satellite
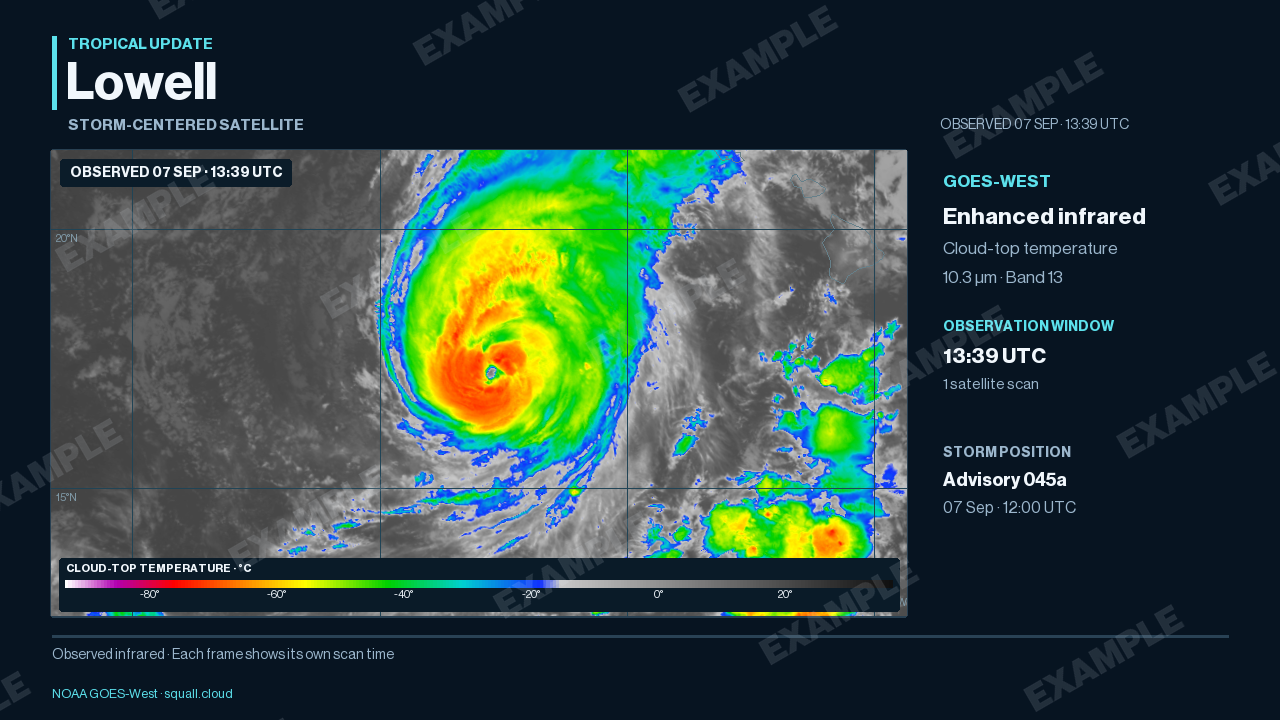
Observed GOES infrared with exact scan times, storm-centered framing and a matching temperature legend.
Create this graphic →4K TELEVISION · YOUTUBE · VERTICAL VIDEO
Satellite imagery, official forecasts, wind threats, and timing.
Build a tropical update with storm-centered satellite loops, formation outlooks, official tracks, ensemble guidance, and detailed wind products. Select a storm in Studio and choose “New hurricane update” for an editable television or portrait sequence, with your branding, narration notes and caption exports.
Fourteen hurricane products · 80-second television and 40-second portrait templates · Narration scripts and timed WebVTT captions export separately; record the voice before publishing.
The images below are dated design examples from 7 September 2026. They are not current advisories. Studio verifies source freshness for each new render.
Observed GOES infrared with exact scan times, storm-centered framing and a matching temperature legend.
Create this graphic →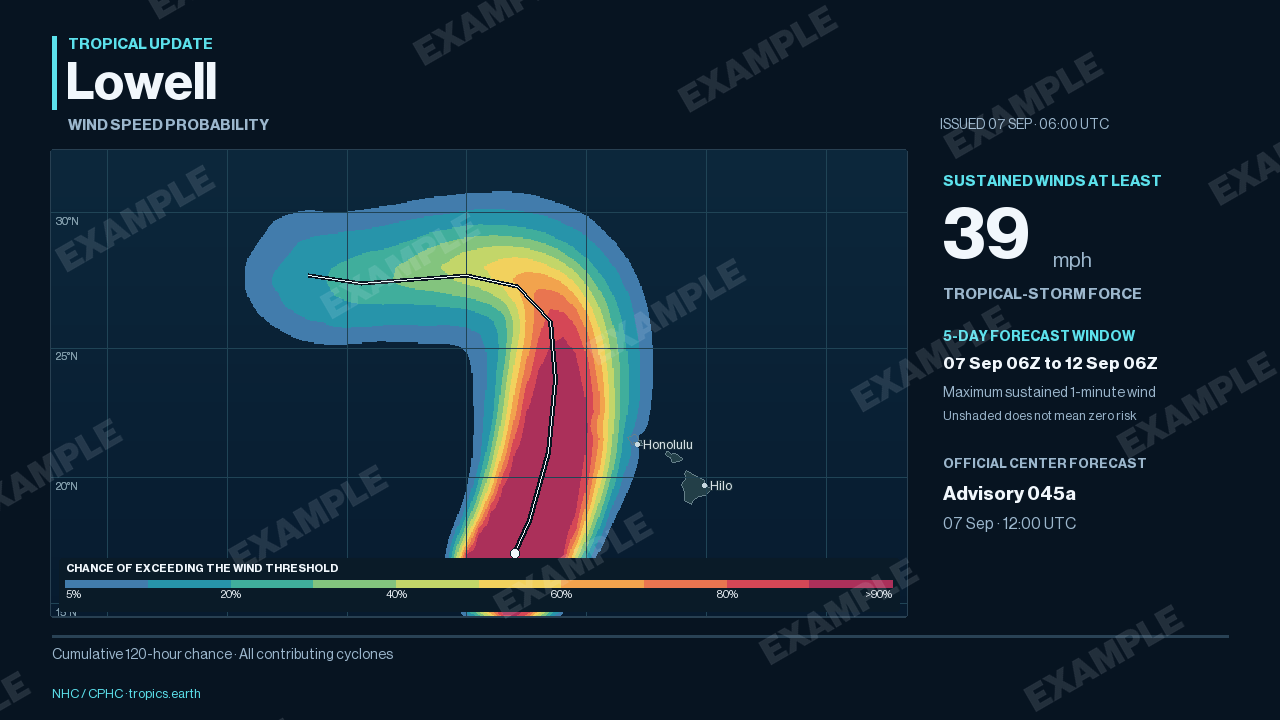
The official five-day chance of sustained winds reaching 39 mph. The map keeps its own model-cycle clock.
Create this graphic →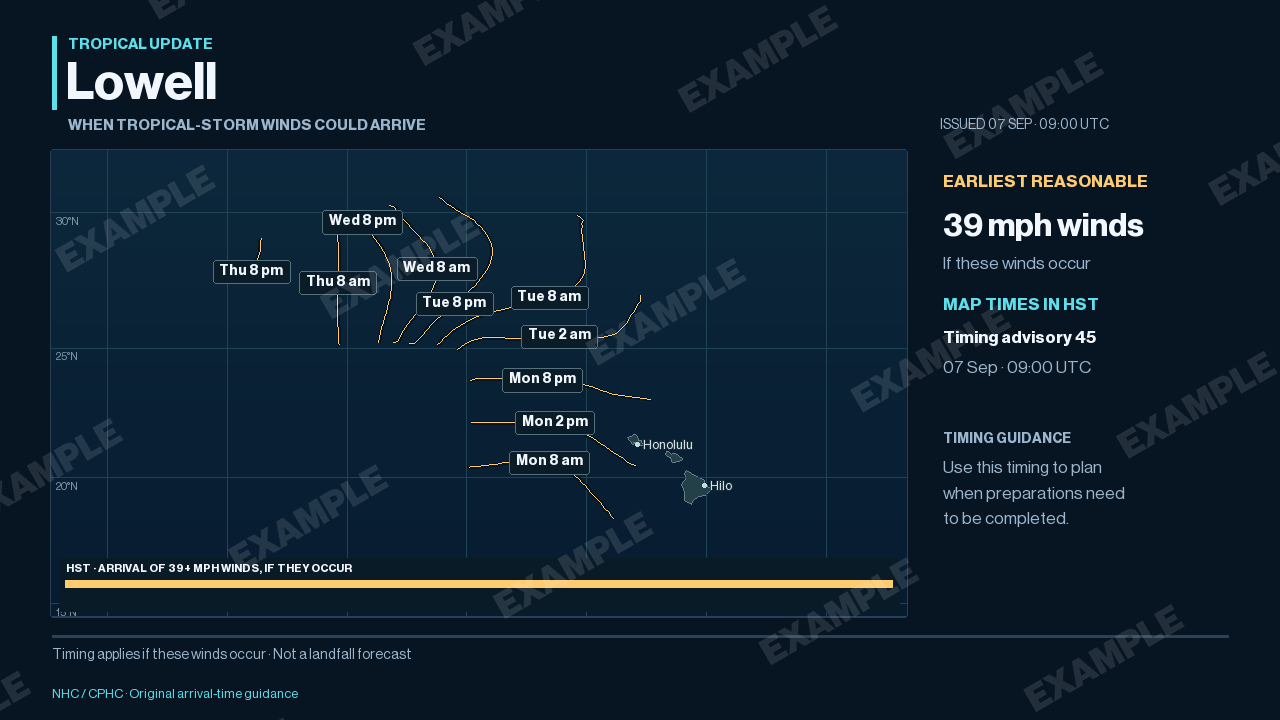
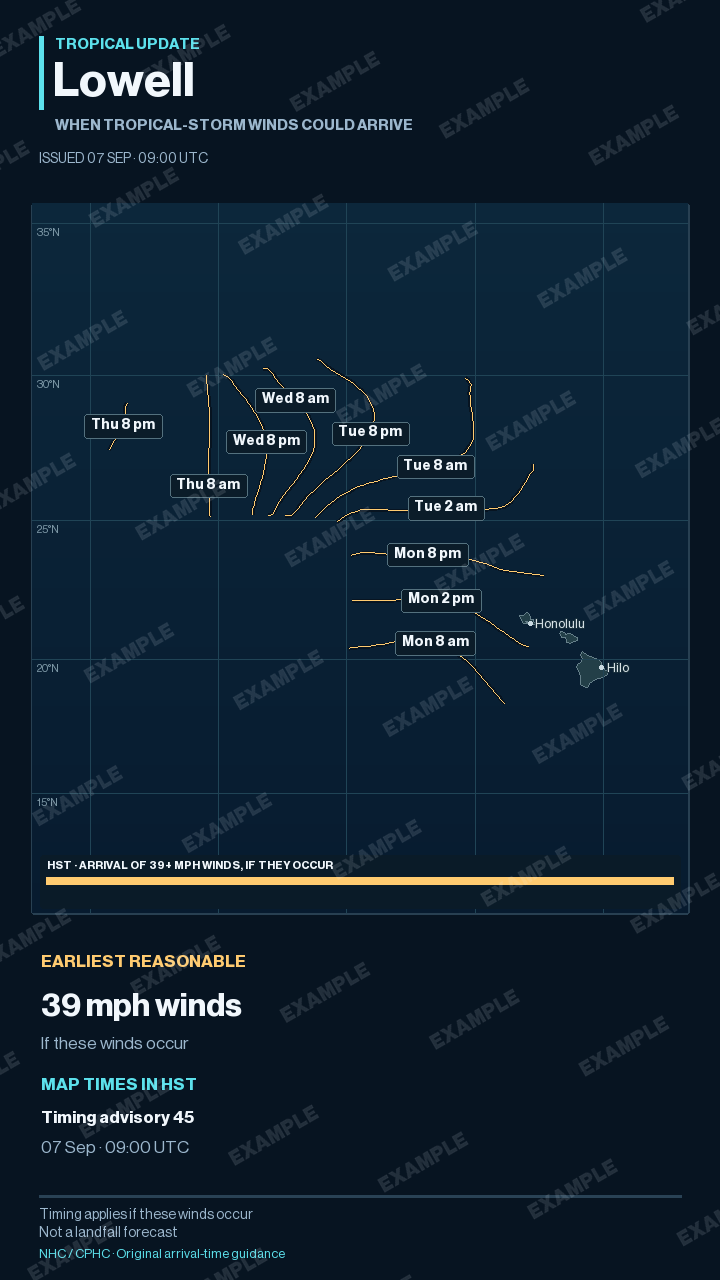
When tropical-storm-force winds could begin, if they occur. The source timezone and timing advisory remain visible.
Create this graphic →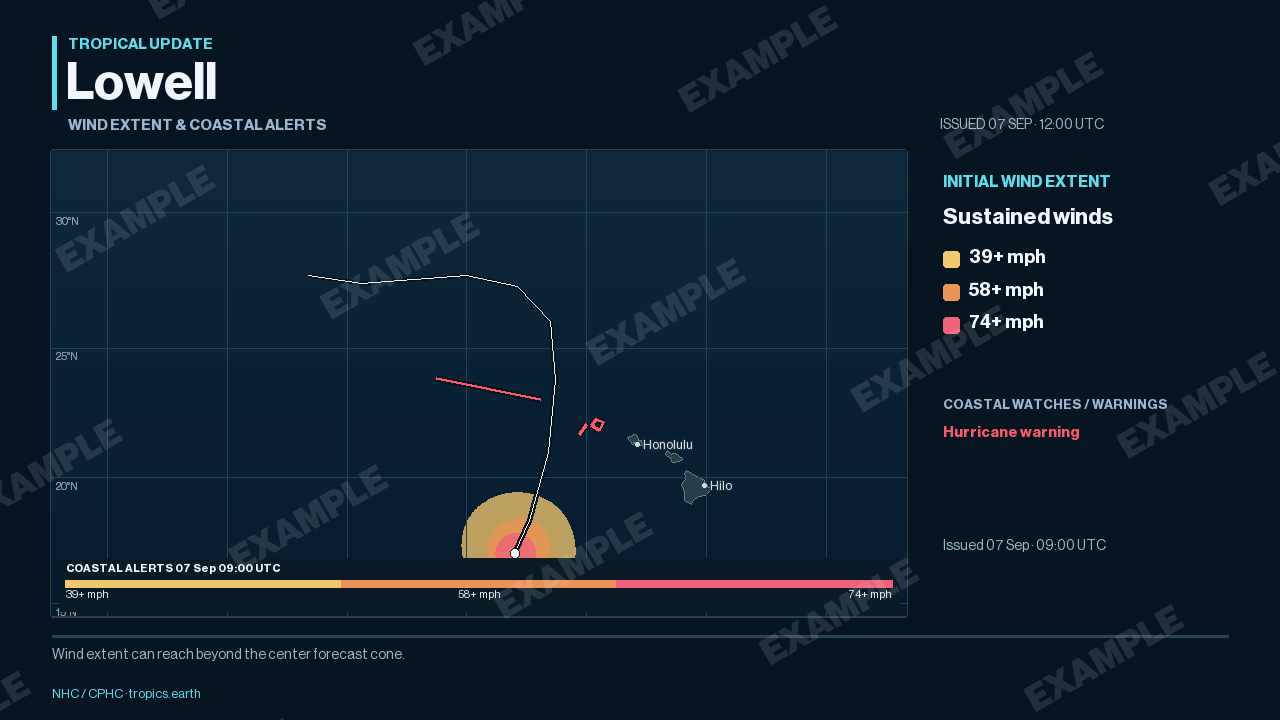
Initial wind polygons and official coastal watches and warnings, with separate issue times when necessary.
Create this graphic →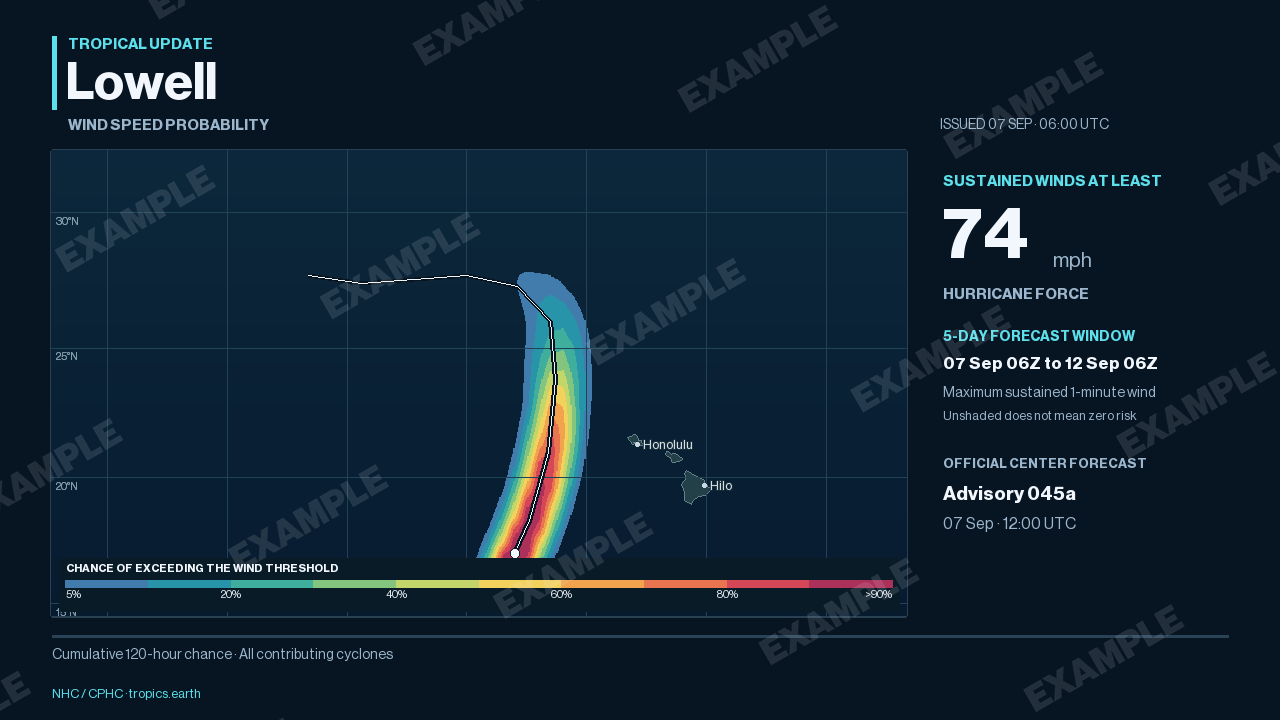
The official five-day chance of sustained winds reaching 74 mph, using the published probability bands.
Create this graphic →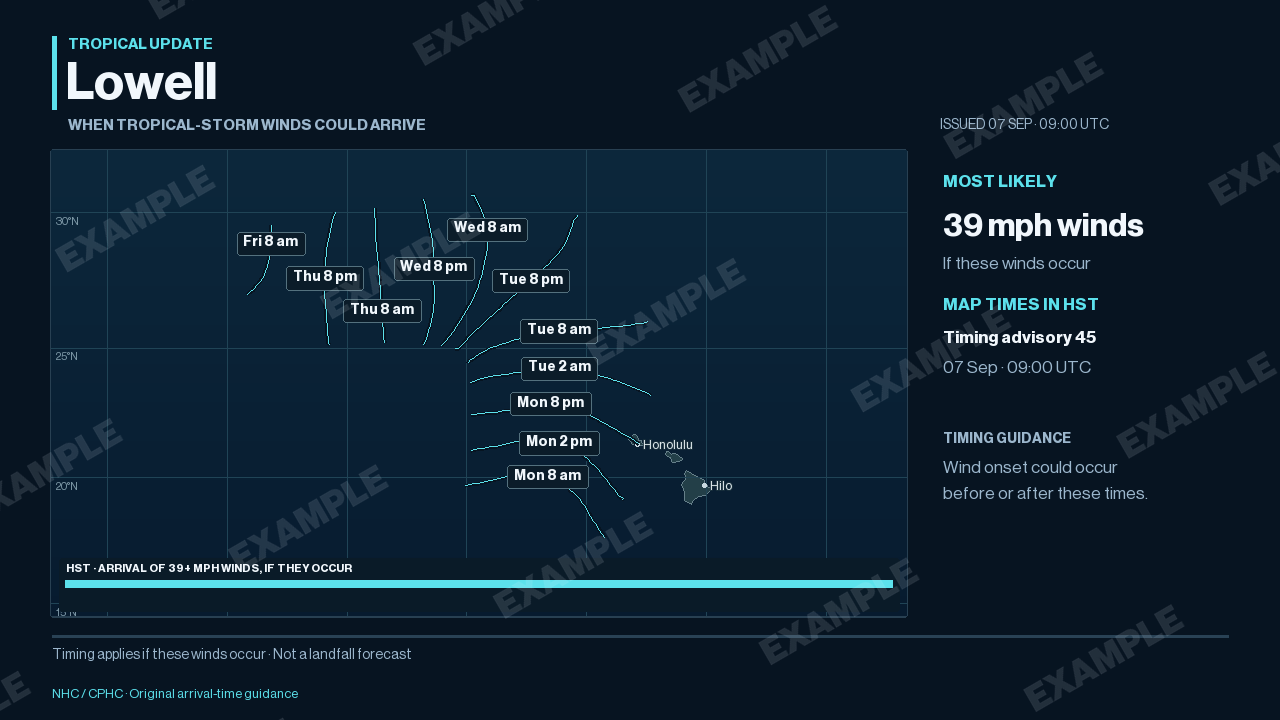
A complementary timing view of tropical-storm-force wind onset, conditional on those winds occurring.
Create this graphic →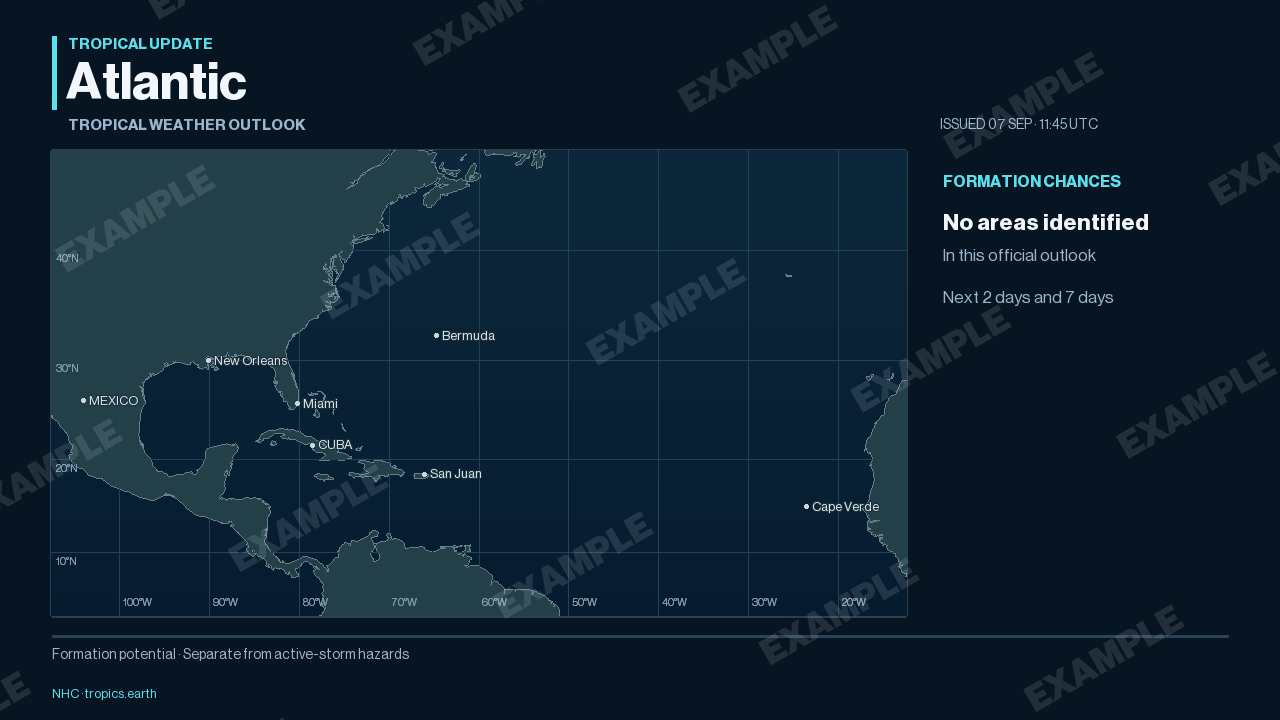
Official seven-day development areas, with the two-day and seven-day chances shown separately.
Create this graphic →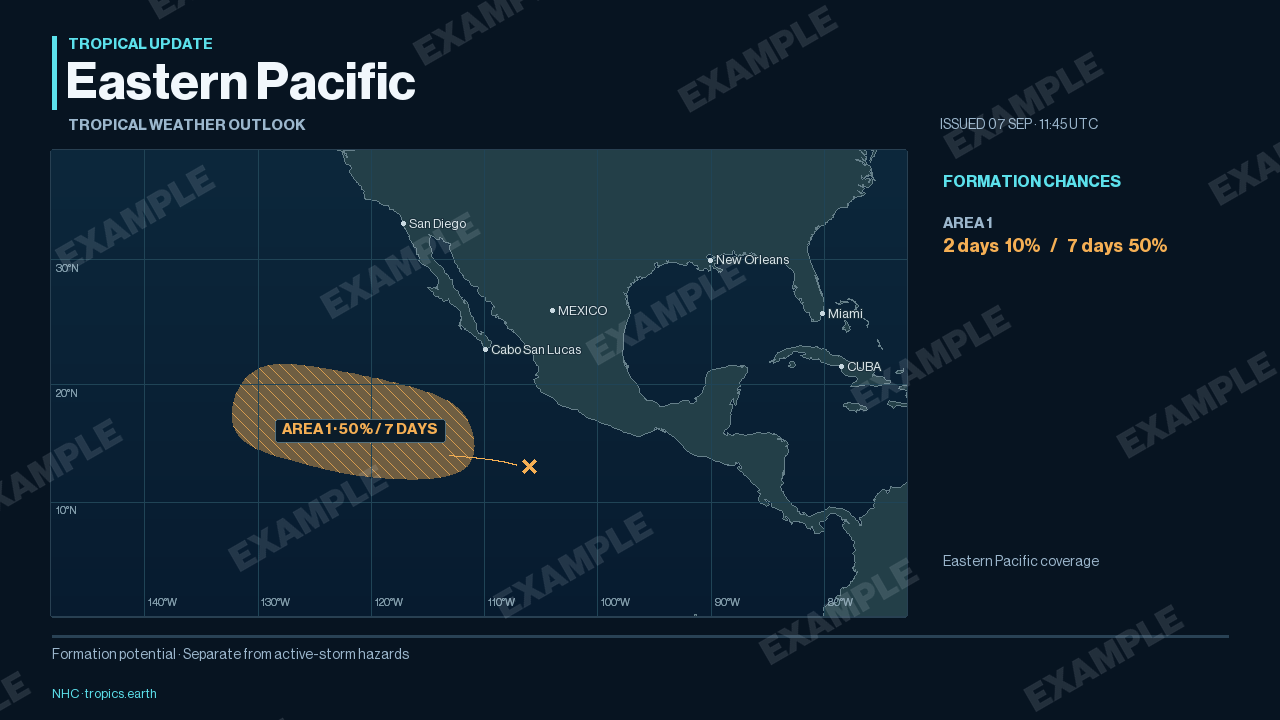
Published eastern Pacific development areas and formation chances. Central Pacific outlook coverage is separate.
Create this graphic →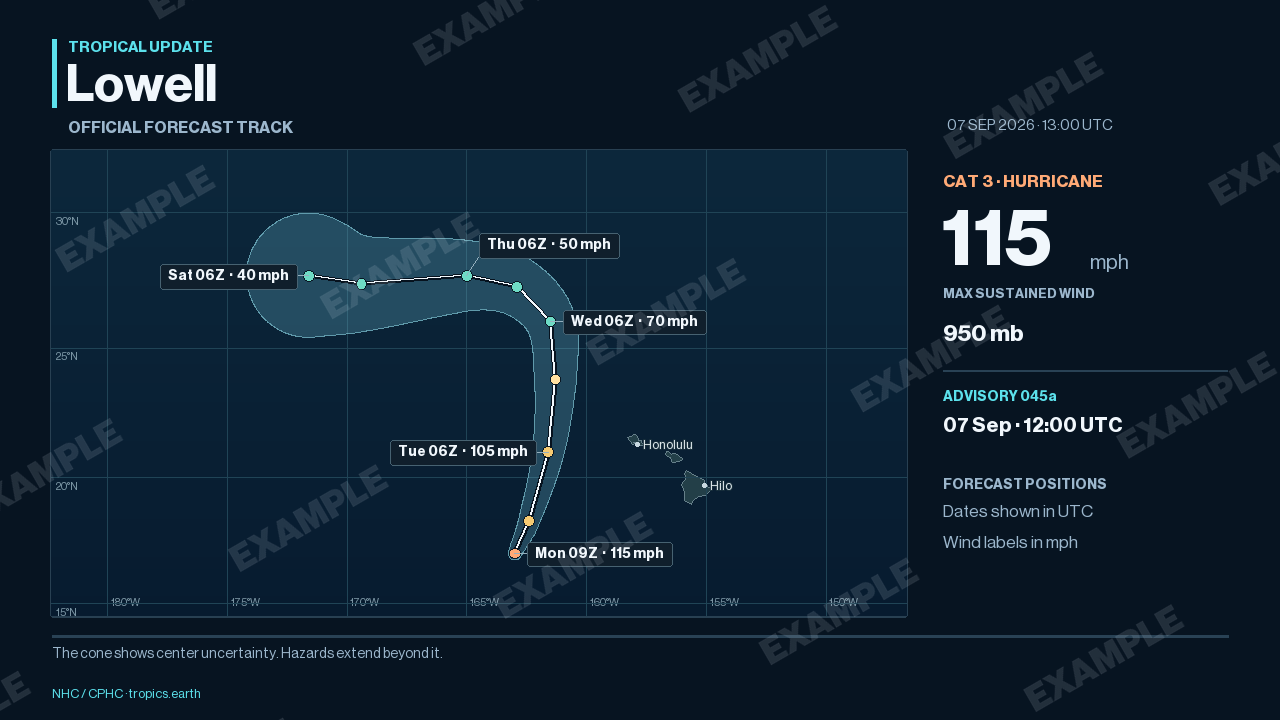
Matching advisory geometry, UTC forecast positions and wind labels. The cone describes center uncertainty; hazards can extend outside it.
Create a track graphic →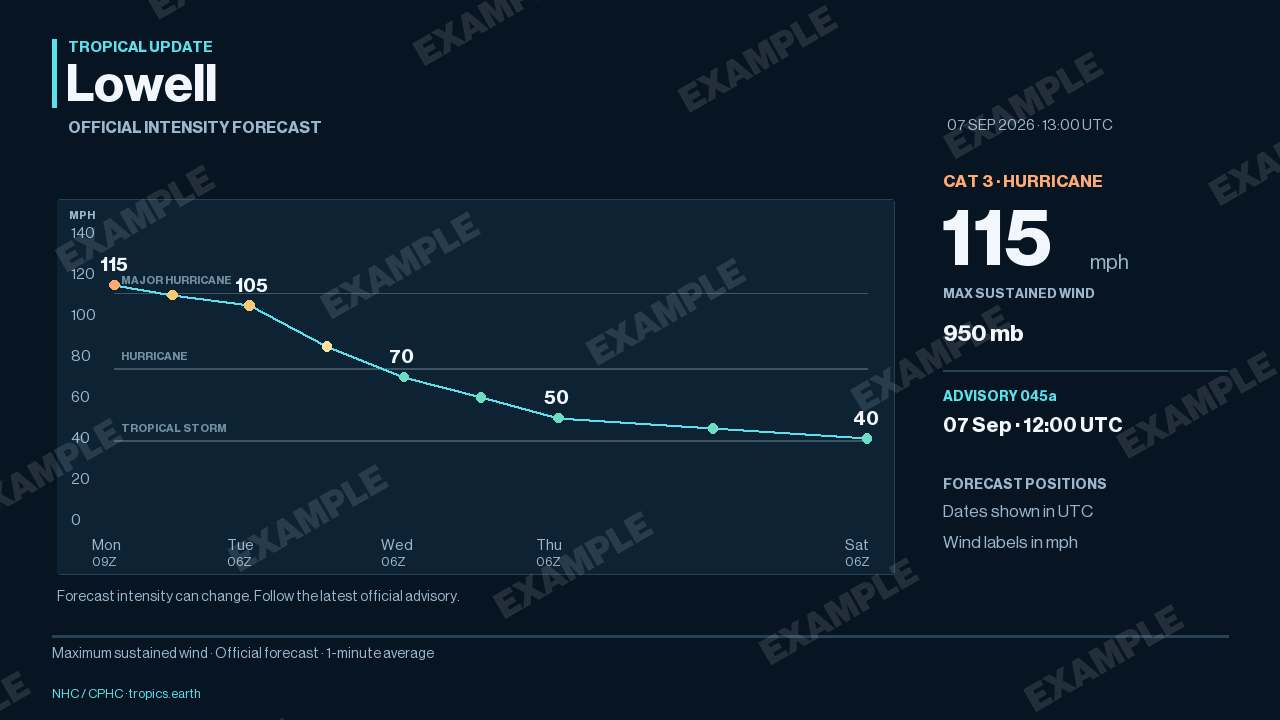
Official maximum sustained wind through the forecast, with tropical-storm, hurricane and major-hurricane thresholds.
Create an intensity graphic →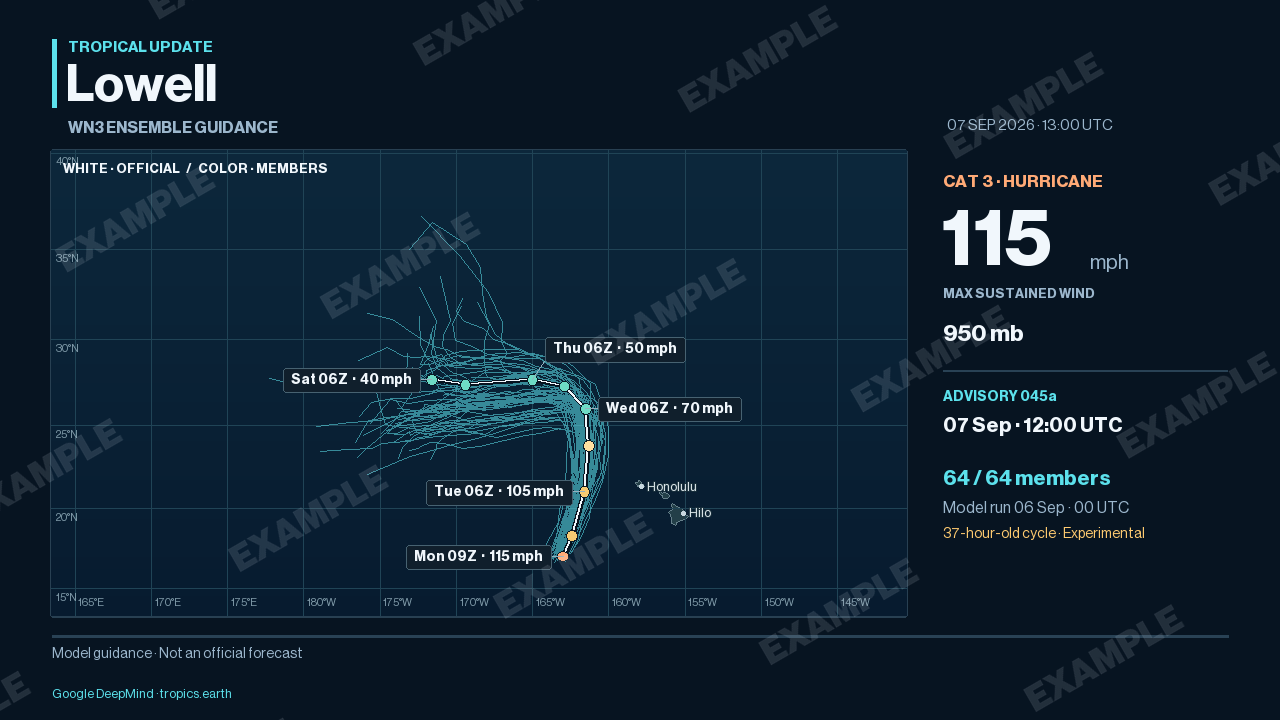
Experimental Google DeepMind member tracks alongside the official forecast. The model cycle, age and displayed member count stay visible.
Create a WN3 graphic →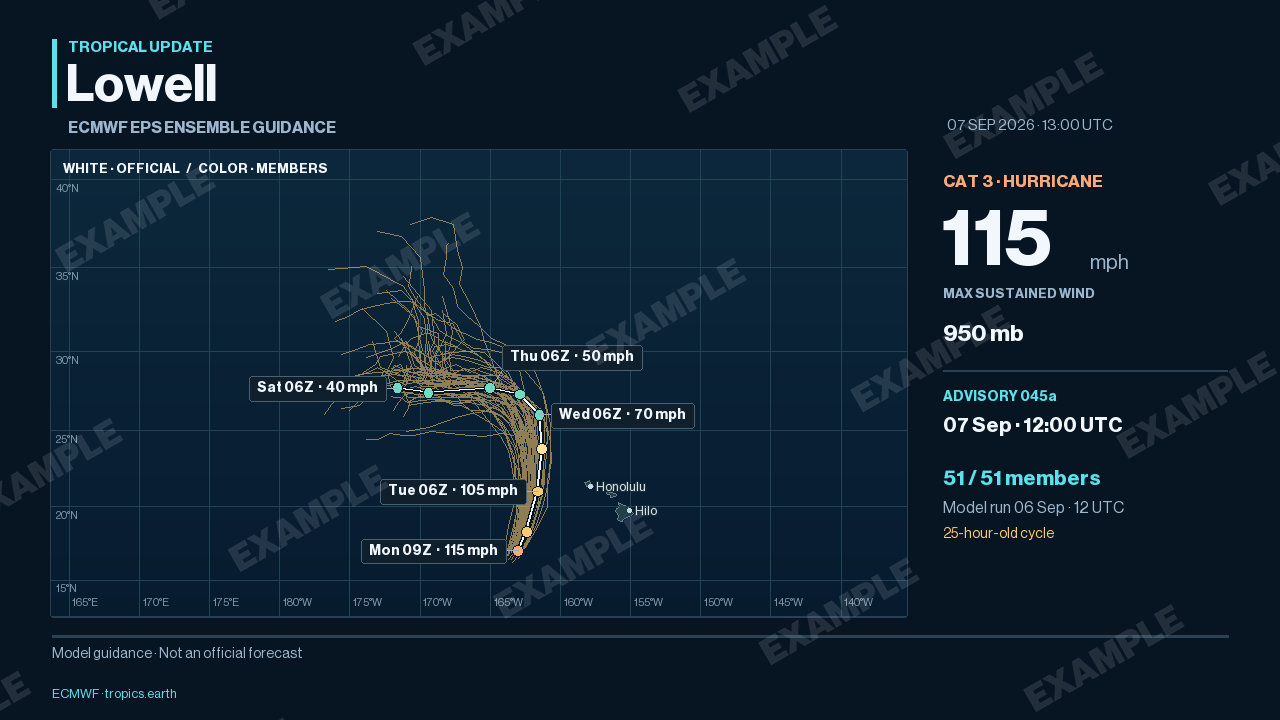
Ensemble paths with the official track distinguished in white. Source clocks remain separate so an older model run is easy to identify.
Create an EPS graphic →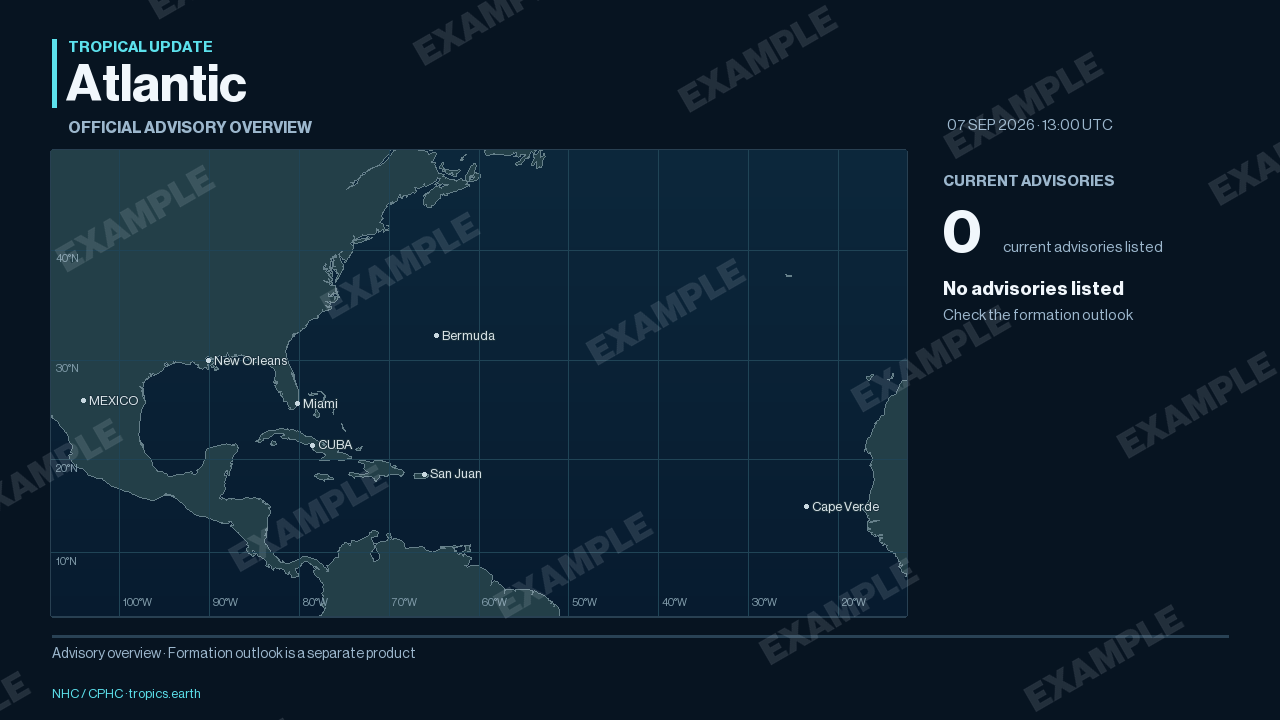
A geographic overview of current advisories. Formation potential is a separate product; an empty advisory list is not an all-clear.
Create an Atlantic update →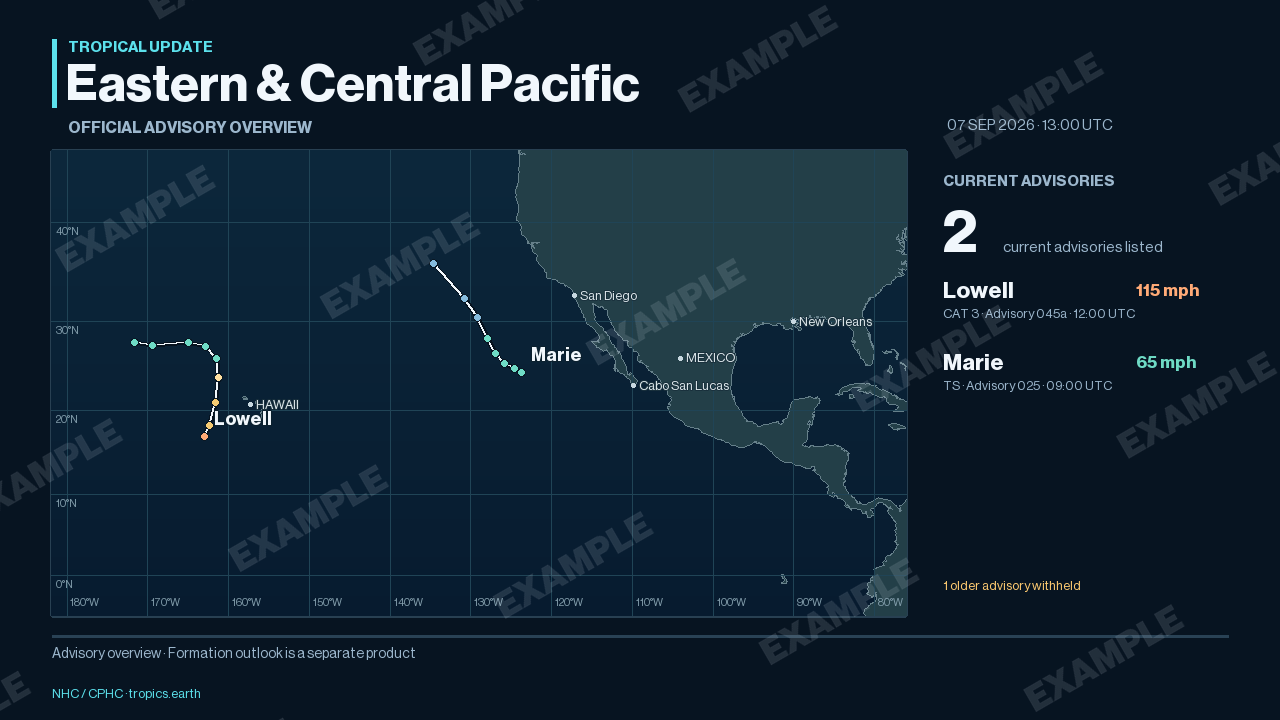
Eastern and central Pacific coverage, including Hawaii. Storm tracks and the advisory roster share one readable map.
Create a Pacific update →The portrait layout keeps the satellite or impact map large, with readable source times and details below. Save the portrait template for a 40-second update.